Power BI vs Tableau in 2025: Which Data Visualization Tool Should You Choose?
Complete Power BI vs Tableau comparison in 2025: features, pricing, ease of use, AI and performance. Guide to choosing the best Business Intelligence tool.
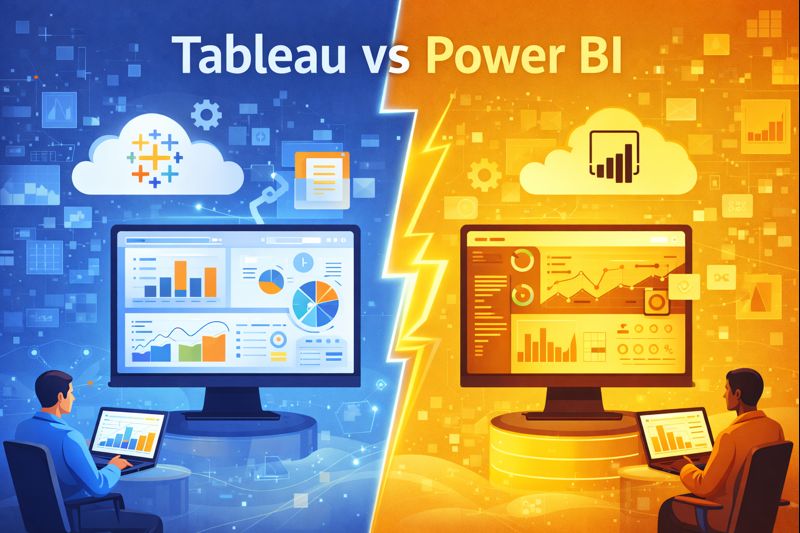
Power BI vs Tableau: The Battle of BI Giants
In 2025, Power BI and Tableau remain the two undisputed leaders in Business Intelligence according to the Gartner Magic Quadrant. But which one should you choose for your business? At Datakhi, we primarily work with Power BI, but we also know Tableau's strengths. Here's our objective analysis.
Quick Comparison
| Criteria | Power BI | Tableau |
| Price (per user/month) | $10-20 | $35-75 |
| Ease of Learning | Easy | Moderate |
| Advanced Visualizations | Good | Excellent |
| Large Volume Performance | Good | Excellent |
| Microsoft Integration | Native | Limited |
| 2025 Market Share | 13.92% | 13.03% |
Pricing and Licenses: Advantage Power BI
This is often the decisive criterion for SMBs:
Power BI
- Power BI Desktop: Free (report creation)
- Power BI Pro: $10/user/month (sharing and collaboration)
- Power BI Premium per user: $20/user/month (advanced features)
- Power BI Premium per capacity: Starting at $4,000/month (for large organizations)
Tableau
- Tableau Viewer: $12-15/user/month (read-only)
- Tableau Explorer: $35/user/month (exploration)
- Tableau Creator: $75/user/month (full creation)
Verdict: Power BI is 3 to 5 times cheaper than Tableau for equivalent features. For a team of 10 users, this represents savings of $3,000 to $6,000/year.
Ease of Use: Power BI More Accessible
Power BI
Power BI's interface is designed for business users with little or no technical knowledge:
- Interface similar to Excel (familiar to most)
- Pre-built templates and drag-and-drop visuals
- Native integration with Microsoft ecosystem (Excel, Teams, SharePoint)
- Learning curve: 2-4 weeks to become operational
Tableau
Tableau offers more flexibility but requires more investment:
- Powerful but less intuitive interface
- Specific concepts to master (dimensions, measures, LOD expressions)
- Learning curve: 1-2 months to be truly effective
Verdict: If your users are already in the Microsoft ecosystem, Power BI will be adopted more quickly.
Visualizations: Tableau Excels
This has historically been Tableau's strong point:
Tableau
- Stunning and highly customizable visualizations
- Native advanced charts (Sankey, complex treemaps, geospatial)
- Fine control over every visual element
- Ideal for data storytelling and executive presentations
Power BI
- Large library of visuals (native + AppSource)
- Decent customization but less advanced
- Custom visuals via R, Python or Deneb (Vega-Lite)
- Sufficient for 90% of enterprise use cases
Verdict: For very advanced visualization needs or data journalism, Tableau remains superior. For standard enterprise reporting, Power BI is more than enough.
Performance and Scalability
Large Data Volumes
Tableau is historically faster and more efficient at handling very large datasets without Power BI's limitations.
Power BI performs well with medium-sized datasets but can slow down beyond a few million rows without optimization (DirectQuery mode, aggregations, composite model).
With Microsoft Fabric
In 2025, Power BI integrated with Microsoft Fabric changes the game with Direct Lake mode offering near real-time performance on massive volumes stored in OneLake.
Artificial Intelligence in 2025
Both platforms have made major AI progress this year:
Power BI Copilot
- Visual generation in natural language
- Assisted DAX measure creation
- Automatic summaries and insights
- Azure ML integration for predictive analytics
- Available on all paid SKUs since April 2025
Tableau Pulse
- Smart alerts and automated storytelling
- NLP to surface insights
- Einstein Discovery for predictive analysis
Verdict: Tie in 2025, both platforms integrate AI in a relevant way.
Integrations and Ecosystem
Power BI
- Microsoft 365: Excel, Teams, SharePoint, OneDrive
- Azure: Synapse, Data Factory, ML, Fabric
- Dynamics 365: CRM, ERP
- Native SQL Server
Tableau
- Salesforce (parent company since 2019)
- Google: BigQuery, Analytics, Sheets
- AWS: Redshift, Athena
- More flexible multi-cloud
Verdict: If you're a Microsoft company, Power BI is the natural choice. If you use Salesforce or a multi-cloud environment, Tableau may be more suitable.
Our Recommendation
Choose Power BI if:
- You already use Microsoft 365/Azure
- Budget is a constraint
- Your users are not data experts
- You want a quick learning curve
- You're considering Microsoft Fabric
Choose Tableau if:
- You have very advanced visualization needs
- You work with Salesforce
- You're in a multi-cloud environment (AWS, GCP)
- You have massive data volumes and experienced analysts
Conclusion
In 2025, Power BI has slightly overtaken Tableau in market share (13.92% vs 13.03%), mainly due to its value for money and Microsoft integration. But Tableau remains an excellent choice for organizations with advanced visualization needs.
At Datakhi, we are certified Power BI experts and help companies deploy and optimize their BI solutions.
Need help choosing or deploying your BI tool? Contact our experts for personalized advice.